A barebones no frills introduction to displaying the most basic of charts, a Bar Chart.
Swift Charts is a powerful and user-friendly library for creating beautiful and engaging charts in iOS applications. With a simple, and easy implementation method and a wide range of customization options, Swift Charts allows developers to quickly and easily create a variety of chart types, including line, and bar charts. Whether you’re a beginner or an experienced developer, Swift Charts is an essential tool for creating engaging data visualizations in your iOS app.

Great, so how do I implement it?
Within the view in which you’d like to display a chart, simply import the Charts library.
import ChartsThen within your view body, you’ll simply implement a simple chart of your choice, such as BarMark. We’ll implement it in this method within a ForEach in order to allow for customization in the future.
import SwiftUI
import Charts

struct ChartView: View {
  var body: some View {
    VStack {
      Chart {
        ForEach(yourDataSet) { data in
          BarMark(
            x: .value("Data Date", data.date, value: .week)
            y: .value("Data Price", data.price)
          )
        }
      }
    }
  }
}
Your data set will need to conform to Random Access Collection and Identifiable. For instance, you could create a model for an object you want to represent data for, and then create an array of that model. If your model does not conform to Identifiable, you could get away with simply adding id: \.self within the ForEach parameters.
As you can see within the XAxis, there is an added parameter called value. If your data model has a variable you’re using within your chart that is of type Date, Swift will automatically infer that you’re looking to select a DateComponent to set as the value. Which means, you will be able to narrow your data set down to any DateComponent.
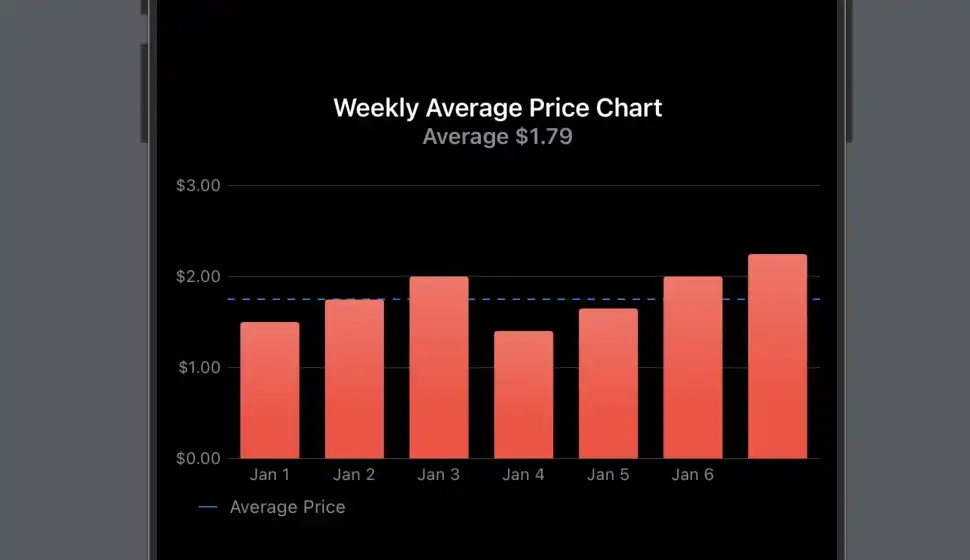
As simple as that, we have drawn out a very basic implementation of a Bar Chart. From here, we can work on customizing them to our liking using simple view modifiers provided by the library. In the next article on Swift Charts, I’ll detail how I obtained the above visual design.
In conclusion
Apple did a great job with this framework as it is incredibly intuitive. It provides developers with a very easy way to implement beautiful adaptive graphics to represent various types of data. One thing to keep him ind however is that one chart that is missing from our toolbox is the Pie Chart. After speaking with Apple evangelists during one of the WWDC22 Slack Sessions they do have plans to implement them in the future.